Polygon Price Booms 30% In A Week Unbothered By Bitcoin’s Pullback, Can MATIC Hit $1.25?
Release: 2023/11/14 22:04 Reading: 672

Altcoin volatility has gone up significantly, calling on traders to be careful with both scalping and day trading activities. Polygon (MATIC) price is among the tokens showing high volatility on Tuesday, up 8% to trade at $0.9358.
Backing the uptrend is a massive increase in the 24-hour trading volume to $1.25 billion and a 7.34% surge in the market cap to $8.6 billion.
In addition to increasing investor interest, especially among whales, the technical outlook has been bullish since October 20. It is plausible for Polygon price to close the day above $1 and even push to the falling wedge pattern breakout target at $1.25.
Recommended for you: Crypto Prices Today: BTC & RPL Soar, While Pepe Coin Remains Flat
Whales Scoop MATIC Bolstering Polygon Price Rally
Institutional and whale demand for the layer 2 solutions protocol token appears to be back, according to blockchain analytics platform IntoTheBlock. Select assets like Polygon are seeing more than 170% in on-chain transaction volume.
“Institutional and whale demand has picked up strongly, with Bitcoin seeing an 80% increase in the volume of transactions of over $100k, Ethereum 170%, and Polygon over 3,800% compared to 30 days ago,” IntoTheBlock said via a post on X.
As big players stream into the market, they help build the momentum to sustain the uptrend. This could be one of the reasons for keeping MATIC price in the green even as other tokens around it trim gains.
Institutional and whale demand has picked up strongly, with Bitcoin seeing an 80% increase in the volume of transactions of over $100k, Ethereum 170%, and Polygon over 3,800% compared to 30 days ago. pic.twitter.com/ElM1CDZ3wA
— IntoTheBlock (@intotheblock) November 11, 2023
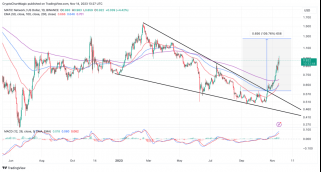
Meanwhile, Polygon price is in the middle of a falling wedge pattern breakout which could push the uptrend to $1.25. As shown on the chart, a falling wedge forms toward the of a downtrend.
It signifies a loose bearish grip while signalling the possibility of a trend change. Traders usually time their long entries above the upper descending trendline resistance.
For the breakout to be impactful, it must be accompanied by a substantial increase in trading volume like in MATIC’s case.
Traders would usually follow the breakout through to the target, in this case, 109% from the breakout point to $1.25. However, it is prudent to lock in the gains at various levels, especially at the key resistance area like $1.
That said those interested in keeping their positions open may continue doing so as long as the Moving Average Convergence Divergence (MACD) dons a buy signal. In addition to the call to traders to seek more exposure to MATIC, the momentum indicator’s position at 0.019 depicts a bullish thesis.
The bullish cross formed on the same daily chart by the 50-day Exponential Moving Average (EMA) (red) crossing above the long-term 100-day EMA (blue) further reinforced the bulls’ presence in the market.
A higher support at $0.9 would also encourage holders to stay put amid the outlook for gains above $1.25. On the other side of the fence, losing the same level of support might result in losses as Polygon price seeks support ahead of the next breakout.
Related Articles
- Hedge Funds’ Skepticism Grows as Asset Managers Go Long on BTC
- Bitcoin Drops Below $36,500 As Investors Await October CPI Data
- SOL Poses Remarkable Performance Despite FTX Asset Liquidation
The post Polygon Price Booms 30% In A Week Unbothered By Bitcoin’s Pullback, Can MATIC Hit $1.25? appeared first on CoinGape.
Recent news
More>- Homosexual Pepe Solana Memecoin to Rally 18,000% Before Exchange Listing, While SHIB, BONK and DOGE Crash 01-01
- BTFD Presale Captivates Investors in the Best New Meme Coin Presales for Significant Returns as PEPE and SPX6900 Dominate the Scene Fuel the... 01-01
- Homosexual Pepe (HOMOPEPE) Solana Memecoin to Rally 18,000% Before Exchange Listing, While SHIB, BONK and DOGE Crash 01-01
- The Metrics Pointing to Massive Potential for WIF, JASMY, and PEPE in 2025 01-01
- BTFD Coin’s Presale is Unmissable Amid Pepe and Moo Deng’s Crypto Hype: Best Meme Coin Presales to Join This Week 01-01
- Homosexual Pepe (HOMOPEPE) Solana Memecoin to Rally 18,000% Ahead of Exchange Listing, While SHIB, BONK and DOGE Crash 01-01
- Crypto Gems for the Next Quarter: Top 5 Tokens to Watch 01-01
- Why $PEPE Jumped 20% Today And Which Coin Could Be Next 01-01
- Best New Meme Coins to Join for Short Term: BTFD Raises $4.7M in Presale as BONK Boasts Low-Cost Transactions and PEPE Enjoys Steady Followi... 01-01
Selected Topics
More>>-

- pepecoin Price Analysis
- This topic provides articles related to PepeCoin price, covering key PepeCoin insights and analysis
-

- pepe:meme star
- This topic provides articles related to the most promising meme, PEPECOIN, a project with the potential to become a mainstream digital currency. It has the advantages of decentralization, reliability, ease of use, fast speed, low cost and scalability, and is expected to be more widely used in the future
-

- pepecoin price prediction
- We’ve gathered facts about pepecoin’s success story and provided a pepecoin price prediction
Selected Articles
More>>- 1 Avalanche and Aptos rival raises over $600k in 2 weeks
- 2 Crypto Prices Today: Market Continues Rally With BTC, Pepe Coin, SEI Rising
- 3 Major Analyst Crypto Tony Bullish on These Meme Coins, But One Stands Out
- 4 MTAUR Ready to Crush DOGE and PEPE: 100x Price Growth Incoming?
- 5 Memecoins Surge in 2024, Popcat Leads with 7,621% YTD Gain, Outshining Top Crypto Tokens
- 6 PEPE Meme Coin Smashes ATH – See How Much an $83 Investment in Pepe Coin Last Year is Worth Now
- 7 Missed Pepe Unchained? Don’t Worry, This New Pepe-Themed Meme Coin Will Produce Bigger Gains in 2025
- 8 Top 4 Altcoins At 70% Discounts – Last Chance!
- 9 Smart $Pepe trader makes $11.7M profit during Market Drop
- 10 Dogecoin Creator Proposes DOGE to NBA Legend Scottie Pippen
ABOUT US
We are building the most influential,trusted information platform for aglobal community engaged in thd transformation of the financial system andthe emerging crypto economy.PEPE is an integrated platform for media,events,data & indices for the next generation fo investing and the future of money.
Get in touch with the PEPE team at admin@pepecoinbuy.com
