Polygon Price Booms 30% In A Week Unbothered By Bitcoin’s Pullback, Can MATIC Hit $1.25?
ポリゴンの価格はビットコインの下落の影響を受けずに1週間で30%上昇、MATICは1.25ドルに達する可能性があるか?
リリース: 2023/11/14 22:04 読む: 672

Altcoin volatility has gone up significantly, calling on traders to be careful with both scalping and day trading activities. Polygon (MATIC) price is among the tokens showing high volatility on Tuesday, up 8% to trade at $0.9358.
アルトコインのボラティリティは大幅に上昇しており、トレーダーはスキャルピングとデイトレードの両方の活動に注意するよう求めています。ポリゴン(MATIC)価格は火曜日に高いボラティリティを示したトークンの一つで、8%上昇して0.9358ドルで取引された。
Backing the uptrend is a massive increase in the 24-hour trading volume to $1.25 billion and a 7.34% surge in the market cap to $8.6 billion.
上昇傾向を裏付けるのは、24時間の取引高が12億5000万ドルに大幅に増加し、時価総額が7.34%上昇して86億ドルとなったことだ。
In addition to increasing investor interest, especially among whales, the technical outlook has been bullish since October 20. It is plausible for Polygon price to close the day above $1 and even push to the falling wedge pattern breakout target at $1.25.
特にクジラの間で投資家の関心が高まっていることに加えて、10月20日以降、テクニカル見通しは強気になっています。ポリゴン価格が1ドルを超えてその日を終え、下降ウェッジパターンのブレイクアウトターゲットである1.25ドルに到達する可能性さえあります。
Recommended for you: Crypto Prices Today: BTC & RPL Soar, While Pepe Coin Remains Flat
あなたにおすすめ: 今日の仮想通貨価格: BTC と RPL が急上昇する一方、Pepe Coin は横ばいのまま
Whales Scoop MATIC Bolstering Polygon Price Rally
クジラのスクープMATICがポリゴンの価格上昇を後押し
Institutional and whale demand for the layer 2 solutions protocol token appears to be back, according to blockchain analytics platform IntoTheBlock. Select assets like Polygon are seeing more than 170% in on-chain transaction volume.
ブロックチェーン分析プラットフォームIntoTheBlockによると、レイヤー2ソリューションプロトコルトークンに対する機関やクジラの需要が戻ってきているようだという。 Polygon などの特定のアセットは、オンチェーンのトランザクション量で 170% 以上を記録しています。
“Institutional and whale demand has picked up strongly, with Bitcoin seeing an 80% increase in the volume of transactions of over $100k, Ethereum 170%, and Polygon over 3,800% compared to 30 days ago,” IntoTheBlock said via a post on X.
「機関投資家とクジラの需要が力強く伸びており、ビットコインは10万ドル以上の取引量が30日前と比べて80%、イーサリアムは170%、ポリゴンは3,800%以上増加した」とIntoTheBlockはXへの投稿で述べた。 。
As big players stream into the market, they help build the momentum to sustain the uptrend. This could be one of the reasons for keeping MATIC price in the green even as other tokens around it trim gains.
大手企業が市場に流入することで、上昇トレンドを維持する勢いを高めることができます。これは、周囲の他のトークンが利益を削減しても、MATICの価格を緑色に保つ理由の1つである可能性があります。
Institutional and whale demand has picked up strongly, with Bitcoin seeing an 80% increase in the volume of transactions of over $100k, Ethereum 170%, and Polygon over 3,800% compared to 30 days ago. pic.twitter.com/ElM1CDZ3wA
機関投資家とクジラの需要は力強く回復しており、30日前と比較して、ビットコインは10万ドル以上の取引量が80%、イーサリアムは170%、ポリゴンは3,800%以上増加しました。 pic.twitter.com/ElM1CDZ3wA
— IntoTheBlock (@intotheblock) November 11, 2023
— IntoTheBlock (@intotheblock) 2023年11月11日
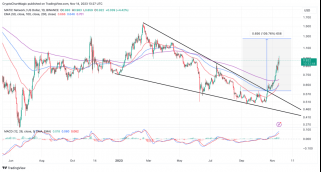
Meanwhile, Polygon price is in the middle of a falling wedge pattern breakout which could push the uptrend to $1.25. As shown on the chart, a falling wedge forms toward the of a downtrend.
一方、ポリゴン価格は下降ウェッジパターンのブレイクアウトの真っ只中にあり、上昇トレンドを1.25ドルまで押し上げる可能性があります。チャートに示されているように、下降トレンドに向かって下降ウェッジが形成されます。
It signifies a loose bearish grip while signalling the possibility of a trend change. Traders usually time their long entries above the upper descending trendline resistance.
これは、トレンドが変化する可能性を示唆しながら、緩やかな弱気相場を示しています。トレーダーは通常、下降トレンドラインの上部抵抗を上回るロングエントリーのタイミングを計ります。
For the breakout to be impactful, it must be accompanied by a substantial increase in trading volume like in MATIC’s case.
ブレイクアウトが影響力を持つためには、MATICの場合のように取引量の大幅な増加が伴わなければなりません。
ポリゴン価格予測チャート |取引ビュー
Traders would usually follow the breakout through to the target, in this case, 109% from the breakout point to $1.25. However, it is prudent to lock in the gains at various levels, especially at the key resistance area like $1.
トレーダーは通常、ブレイクアウトからターゲットまで追跡します。この場合、ブレイクアウト ポイントから 1.25 ドルまでは 109% です。ただし、さまざまなレベル、特に 1 ドルなどの重要な抵抗領域での利益を固定することが賢明です。
That said those interested in keeping their positions open may continue doing so as long as the Moving Average Convergence Divergence (MACD) dons a buy signal. In addition to the call to traders to seek more exposure to MATIC, the momentum indicator’s position at 0.019 depicts a bullish thesis.
つまり、ポジションをオープンのままにしておくことに興味がある人は、移動平均収束ダイバージェンス (MACD) が買いシグナルを発している限り、オープンなポジションを維持し続ける可能性があります。 MATICへのさらなるエクスポージャーを求めるトレーダーへの呼びかけに加えて、モメンタム指標の0.019という位置は強気の理論を示しています。
The bullish cross formed on the same daily chart by the 50-day Exponential Moving Average (EMA) (red) crossing above the long-term 100-day EMA (blue) further reinforced the bulls’ presence in the market.
同じ日足チャート上で、50日指数移動平均(EMA)(赤)が長期100日EMA(青)を上回って形成された強気のクロスは、市場における強気派の存在感をさらに強化した。
A higher support at $0.9 would also encourage holders to stay put amid the outlook for gains above $1.25. On the other side of the fence, losing the same level of support might result in losses as Polygon price seeks support ahead of the next breakout.
0.9ドルというより高いサポートも、1.25ドルを超える上昇が見込まれる中、保有者が現状維持を促すことになるだろう。フェンスの反対側では、ポリゴン価格が次のブレイクアウトに先立ってサポートを求めているため、同じレベルのサポートを失うと損失が発生する可能性があります。
Related Articles
関連記事
- Hedge Funds’ Skepticism Grows as Asset Managers Go Long on BTC
- Bitcoin Drops Below $36,500 As Investors Await October CPI Data
- SOL Poses Remarkable Performance Despite FTX Asset Liquidation
資産運用会社がBTCをロングする中、ヘッジファンドの懐疑論が強まる
投資家が10月のCPIデータを待つ中、ビットコインは36,500ドルを下回る
FTX資産流動化にも関わらずSOLは目覚ましいパフォーマンスを発揮
The post Polygon Price Booms 30% In A Week Unbothered By Bitcoin’s Pullback, Can MATIC Hit $1.25? appeared first on CoinGape.
投稿 ポリゴン価格はビットコインの反落に悩まされずに1週間で30%急騰、MATICは1.25ドルに到達できるか?最初に CoinGape に登場しました。
最近のニュース
もっと>- SHIB、BONK、DOGEが暴落する中、ゲイ・ペペ・ソラナ・メムコインが取引所上場を前に18,000%急騰 01-01
- BTFDのプレセールは、最高の新しいミームトークンのプレセールに投資家を惹きつけ、PEPEとSPX6900が市場を支配し、印象的なリターンをもたらしています... 01-01
- ゲイ・ペペ(ホモペペ)ソラナ・メムコインが取引所上場を前に18,000%急騰、一方SHIB、BONK、DOGEは暴落 01-01
- 2025 年の WIF、JASMY、PEPE の大きな可能性を示す指標 01-01
- Pepe と Moo Deng の仮想通貨誇大宣伝のさなか、BTFD コインのプレセールをお見逃しなく: 今週は最高のミーム コインのプレセールが加わりました 01-01
- ゲイ・ペペ(ホモペペ)ソラナ・メムコインが取引所上場を前に18,000%急騰、一方SHIB、BONK、DOGEは暴落 01-01
- 次の四半期の暗号ジェム: 最も注目すべきトークン 5 01-01
- $PEPE が今日 20% 上昇している理由と次はどのコインになるのか 01-01
- 短期最優秀新ミームトークン:BTFDはプレセールで470万ドルを調達、BONKは低コスト取引、PEPEは堅実な支持者を抱えている… 01-01
注目のトピック
もっと>>-

- ペペコイン価格分析
- このトピックでは、PepeCoin の主要な洞察と分析をカバーする、PepeCoin 価格に関連する記事を提供します。
-

- ペペ:ミームスター
- このトピックでは、最も有望なミーム、PEPECOIN、主流のデジタル通貨になる可能性のあるプロジェクトに関連する記事を提供します。分散化、信頼性、使いやすさ、高速、低コスト、拡張性という利点があり、将来的にはさらに広く使用されることが期待されています。
-

- ペペコインの価格予測
- pepecoin の成功事例に関する事実を収集し、pepecoin の価格予測を提供しました
注目の記事
もっと>>- 1 AvalancheとAptosのライバルが2週間で60万ドル以上を調達
- 2 今日の暗号通貨価格: BTC、Pepe Coin、SEI の上昇により市場は上昇を続ける
- 3 大手暗号通貨アナリストのトニーはこれらのミームコインに強気だが、1つだけ目立ったコインがある
- 4 MTAURはDOGEとPEPEを潰す準備ができている:100倍の価格上昇は来るのか?
- 5 ミームコインは2024年に急騰、ポップキャットは年初から7,621%の上昇で上位の暗号トークンをリード
- 6 PEPE Meme CoinがATHに大ヒット – 昨年投資された83ドルのPepe Coinが今どれだけの価値があるかを見てみましょう
- 7 ペペ アンチェインドを見逃しましたか?心配しないでください、この新しいペペをテーマにしたミームトークンは 2025 年にさらに大きな利益をもたらします
- 8 トップ 4 のアルトコインが 70% オフ – 最後のチャンス!
- 9 賢い $Pepe トレーダーは市場下落中に 1,170 万ドルの利益を得る
- 10 ドージコイン作成者がNBAレジェンドのスコッティ・ピッペンにDOGEを提案

